


Create Yourdon N Coad DFD With AI In Visual Paradigm Online OpenDocs
How to Create Yourdon & Coad DFDs with AI in Visual Paradigm Online OpenDocs Data Flow Diagrams (DFDs) are […]
Video Description
How to Create Yourdon & Coad DFDs with AI in Visual Paradigm Online OpenDocs Data Flow Diagrams (DFDs) are […]

Maintaining object-oriented architecture models using PlantUML class diagrams gives development teams speed and flexibility. However, as software systems expand, manually […]
Data Flow Diagrams (DFDs) using the Gane-Sarson notation provide a clear, standardized way to model system processes, data stores, external […]
Tree Diagrams provide a clean, hierarchical structure for breaking down complex concepts, mapping site architectures, organizing project tasks, and analyzing […]

Fishbone Diagrams (also known as Cause and Effect or Ishikawa Diagrams) are essential visual tools for performing root-cause analysis, identifying […]
Documenting business workflows with Business Process Model and Notation (BPMN) is vital for business analysts, system designers, and process managers […]

UML Composite Structure Diagrams are essential visual models for describing the internal structure of a classifier—including its parts, ports, connectors, […]
Visual Paradigm Chatbot V2 introduces significant upgrades to AI-assisted diagramming, providing enhanced stability, deeper reasoning, and broader support for enterprise […]
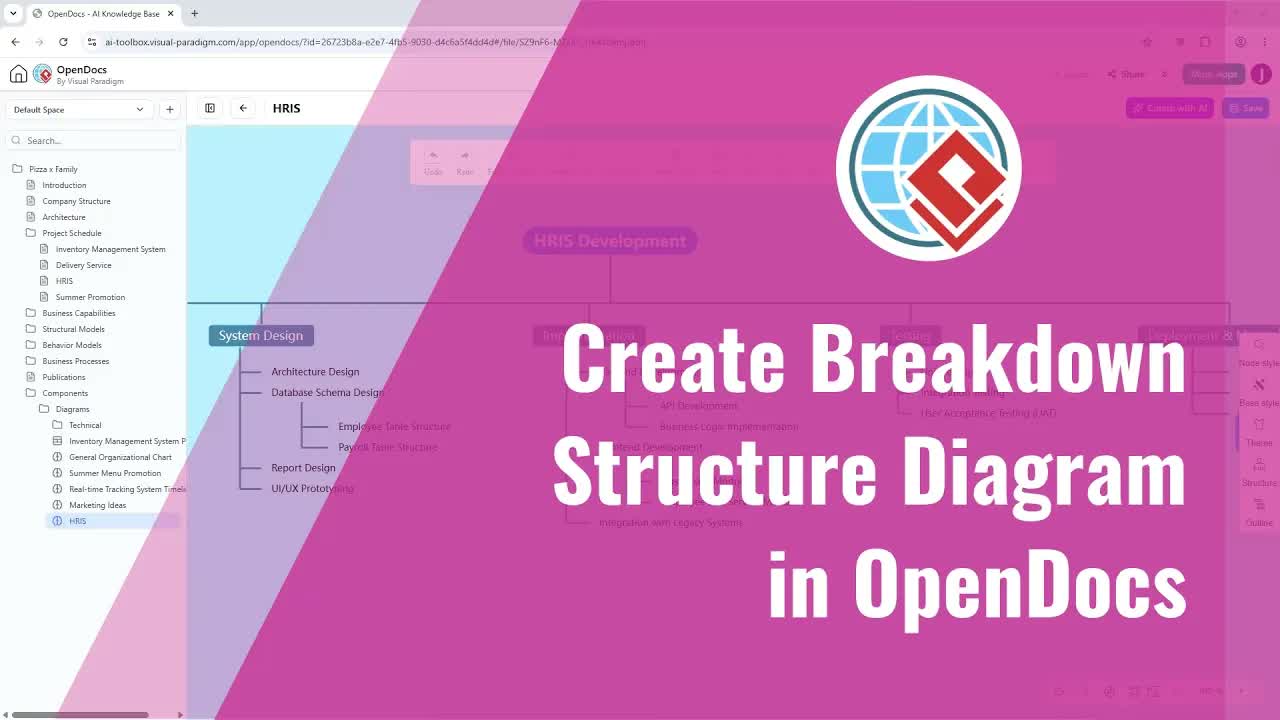
Breakdown Structure Diagrams (such as Work Breakdown Structures or System Breakdown Structures) are essential visual tools for organizing project tasks, […]
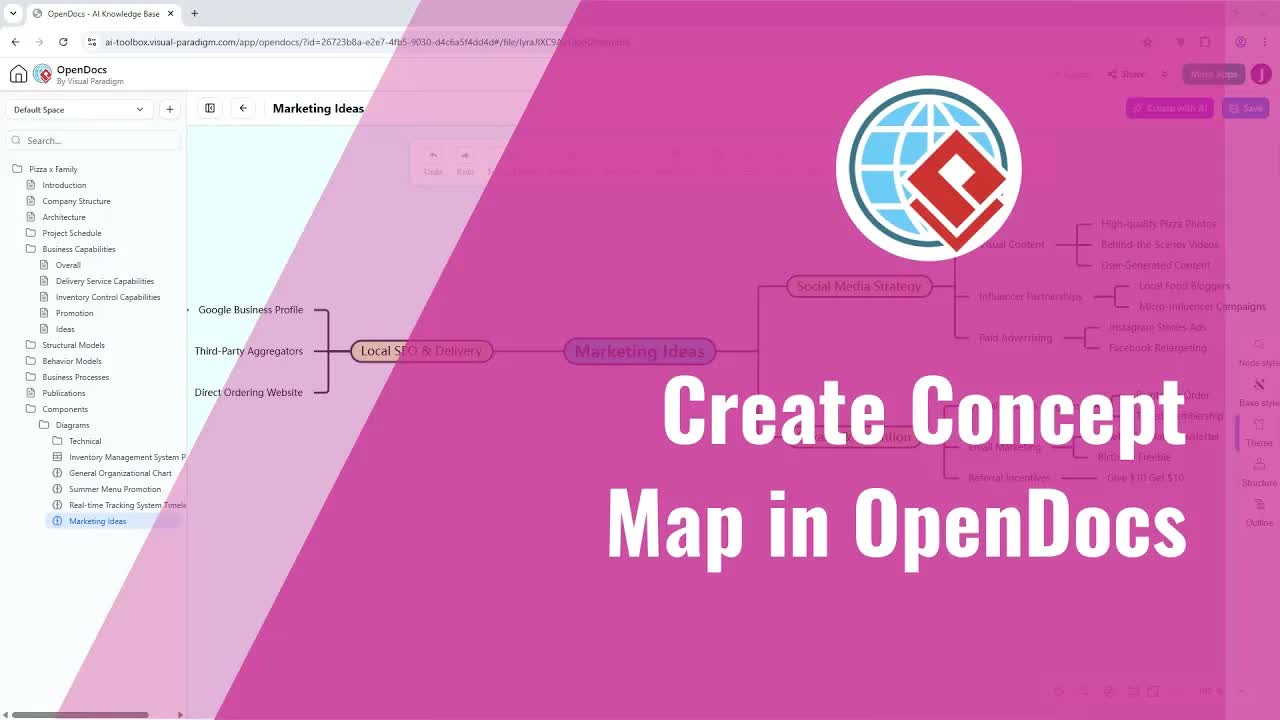
Concept mapping is an exceptionally effective technique for organizing visual knowledge, facilitating brainstorming, and clarifying relationships between complex ideas. Through […]