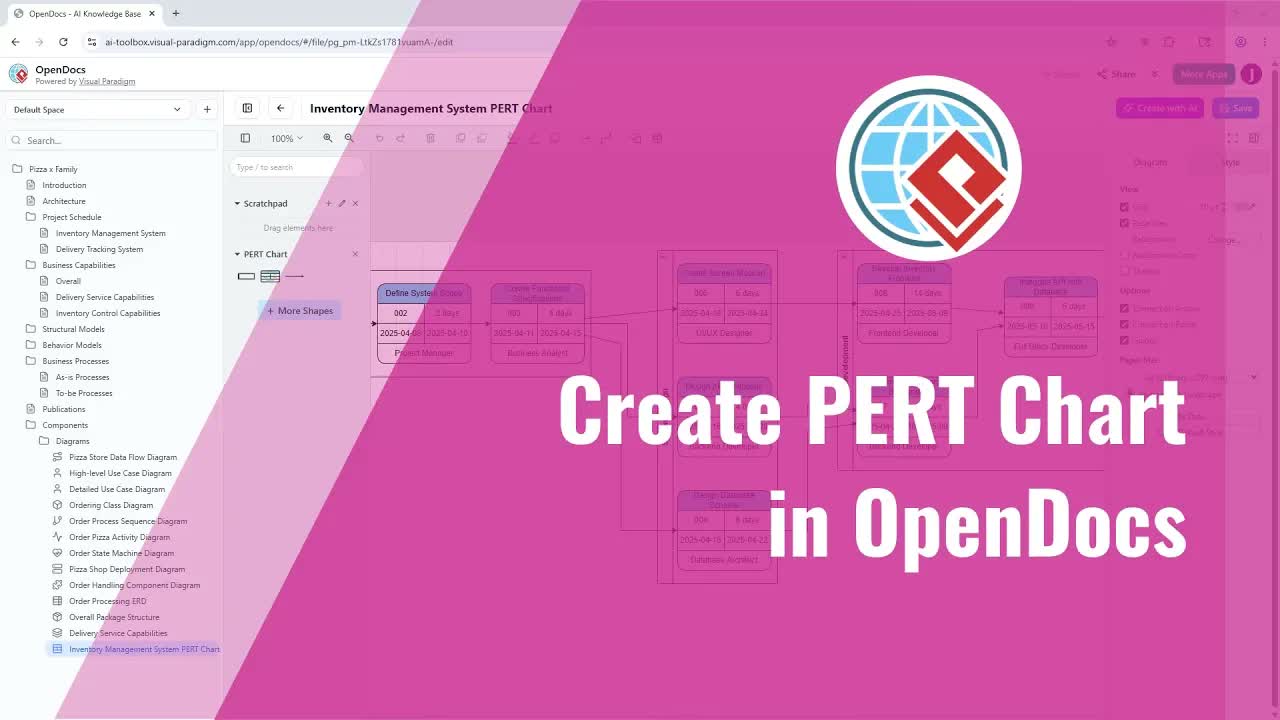
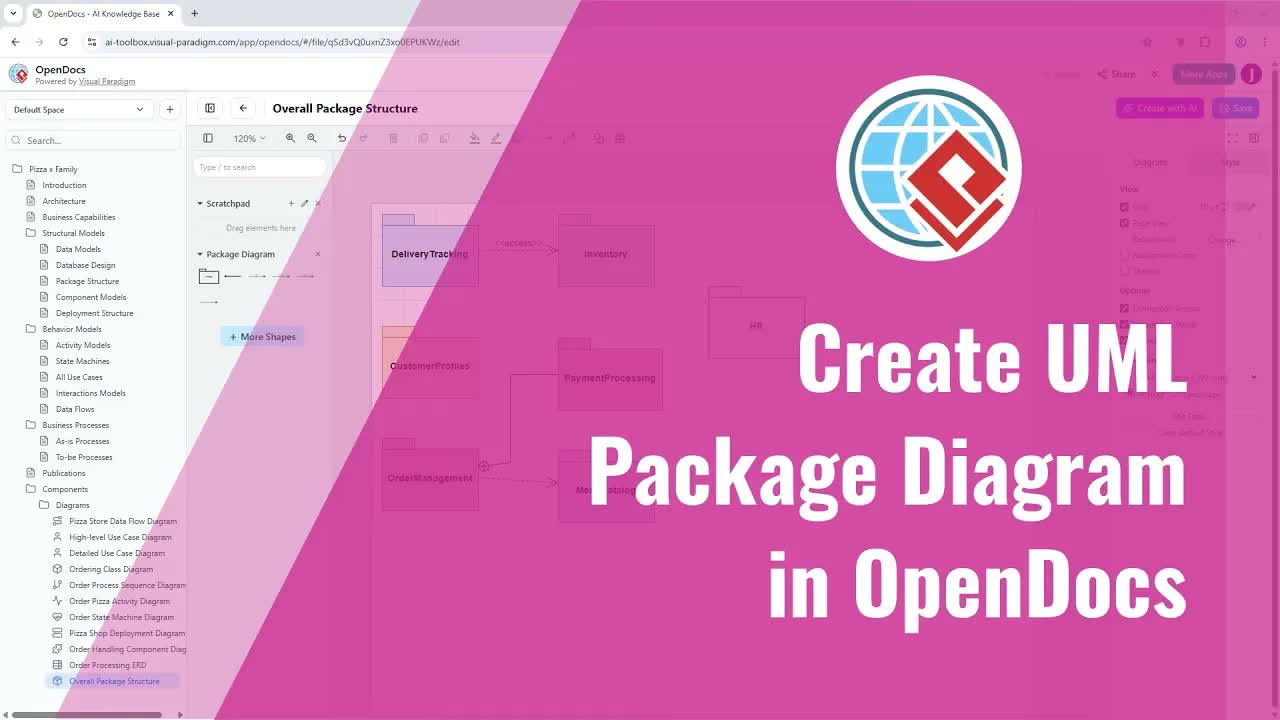
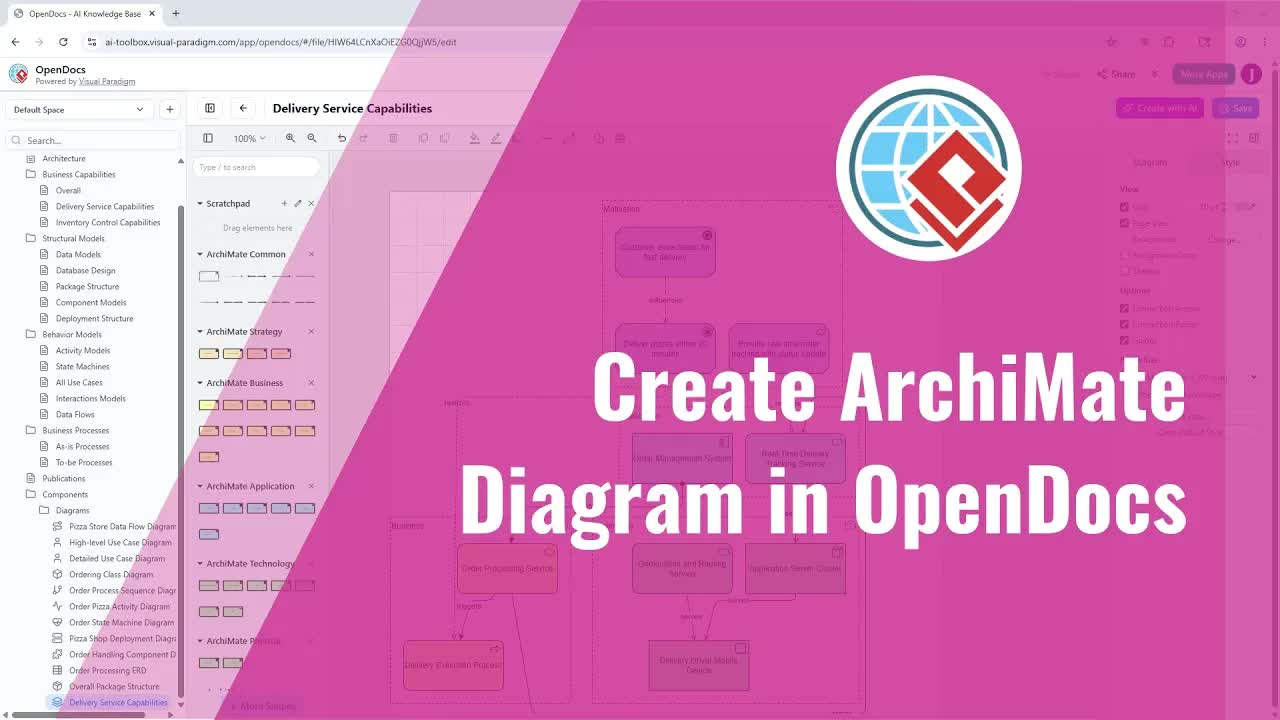
When working with automated software documentation and data visualization tools, keeping your documents looking neat and professional is essential. If you have inserted a chart into an OpenDocs document and noticed unwanted blank margins padding the image, this guide explains why this visual issue occurs and how to fix it in a few simple steps.
Why Charts Display Unwanted Padding or Blank Space
When a chart created in Visual Paradigm Online is inserted into an OpenDocs Tool through the pipeline, extra white space can sometimes frame the diagram.
This layout issue occurs due to default canvas rendering settings:
- Default Canvas Dimensions: The chart editor operates using a default canvas page size by default.
- Unused Page Area Export: Even if your chart or graph only occupies a small fraction of the editor screen, the system exports the image based on the entire canvas area.
- Visible Padding: As a result, the empty surrounding page area gets embedded directly into the exported graphic, appearing as large blank margins once rendered within your document.
Step-by-Step Guide: How to Fix Chart Spacing in OpenDocs
Removing the extra blank space and fitting your chart cleanly inside your documentation requires disabling the page view mode and refreshing the document pipeline revision.
Step 1: Disable Page View in the Editor Settings
- Open your diagram or chart in the editor.
- Click on an empty space in the canvas to ensure no individual diagram elements are selected.
- Navigate to the Settings panel on the side menu.
- Locate the Page View setting and uncheck the checkbox.
- Save your changes to update the project file.
Step 2: Sync the Latest Revision via the Document Pipeline
- Return to your main document.
- Open the Pipeline Panel.
- Switch to the In-Document tab to review embedded project assets.
- Locate your chart, which will display a notification indicating that an update is available.
- Select the chart asset and choose Update to Latest Revision.
Once updated, the embedded image automatically crops to the exact dimensions of your chart content, completely eliminating the unnecessary blank space and integrating seamlessly with your text layout.
Troubleshooting & Interactive AI Assistance
If you encounter additional formatting issues, need custom document layout tweaks, or want to explore automated diagramming workflows, you can converse directly with our embedded intelligent assistants via the Chatbot Tool or the dedicated online Chatbot interface.